 |
|||||||||||||||||||||||||
|
|
|||||||||||||||||||||||||
 |
|||||||||||||||||||||||||
|
|
|||||||||||||||||||||||||
|
|
||||||||||||||||||||


|
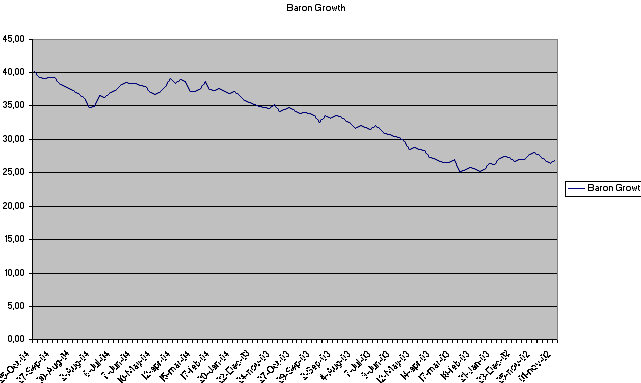
BARON GROWTH (BGRFX) 1. Return, standard deviation and maximum 4-weeks drawdown Data provided by http://finance.yahoo.com has been reorganized to obtain weekly returns in order to estimate cumulative returns, annualized returns, standard deviations, Sharpe ratio, Sortino ratio and information ratio. The graph below shows the trend of Baron growth returns over the two years considered (2002 to 2004 - right to left)
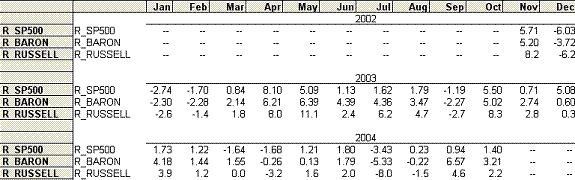
2. Comparison of return, volatility and drawdown of the fund vs. Russell Small Completeness Growth Index and S&P 500 (Historical data for Russell Index have been downloaded at http://www.russell.com/US/Indexes/US/index_values.asp) The table below reports value of monthly rates of return for the fund and the two indexes.
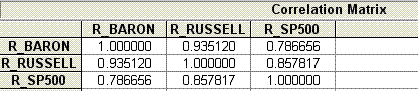
The correlation matrix shows how Russell Index can better depict the trend of the Baron Fund.
But lets look at the composition of the fund and indexes. The S&P 500 index is probably the most commonly referenced U.S. equity benchmark. This diversified index comprises over 70% of the total market cap of all stocks traded in the U.S. Because the index is weighted by market cap, the largest firms have the greatest impact on the S&P's value. The table below lists the current top ten holdings in the S&P (data as of July 2004):
This index is probably the single best way to track the overall performance of US largest and most dominant companies. Most investors are familiar with the S&P 500 and the index is extremely liquid. But because they are unlikely to qualify due to the index's high market cap requirements, the S&P 500 does not provide investors with exposure to some of the smaller, yet in many cases faster growing, companies on the market. In addition, because it is market value weighted, the largest companies in the index have a disproportionate amount of influence on the S&P 500's results. It is the motivation of why Russell Index is much more suitable as benchmark of Baron Fund. In fact the Russell Small Cap Completeness Growth Index is constructed to provide a comprehensive and unbiased barometer for the extended broad growth market beyond the S&P 500. It offers investors the broad U.S. equity growth universe excluding S&P 500 constituents and with higher Price-to-Book ratios (3.74) and forecasted growth values (18,28%). And such a thing is just what Baron Fund does (Price-to-Book = 4.55). The fund invests primarily in common stocks of smaller growth companies selected for their capital appreciation potential. It invests primarily in small sized companies with market values under $2.5 billion. The table below lists the current top ten holdings in the Baron Growth Fund:
Moreover comparing sectors building Baron Growth and S&P500 you can see different composition. The S&P 500 seems to be more balanced than Baron Fund. In fact at a glance the first one shows only a smooth overweighting of financial sector, while the second one is more unbalanced on financial, healthcare and consumer services, quite similar to the Russell Small Cap Completeness Growth Index composition for which largest five sectors by weights are:
Top 10 holdings of Russell index are:
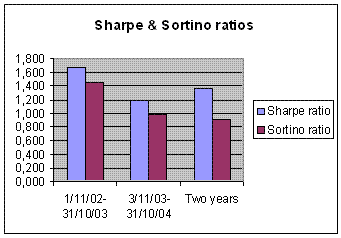
3. Sharpe ratio
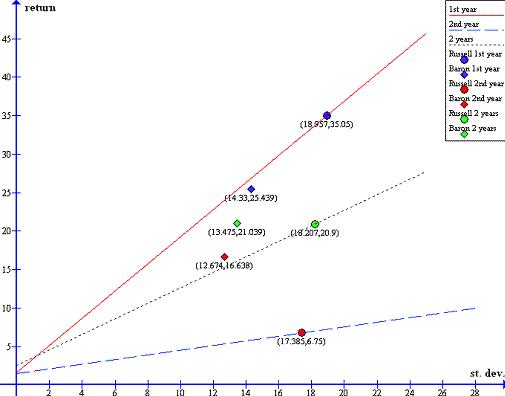
A graphical examination of this ratio that is the slope of line passing through the Baron and RF, or simply looking at the position of Baron fund with respect to the line passing through the benchmark and RF, can help to understand if investing in the fund would have been better or worse than simply investing in the benchmark.
As you can see the fund performs worse than the benchmark in the first examined year, it performs much better than benchmark in the second year, and has an overall better performance in the two years. 4. Sortino ratio
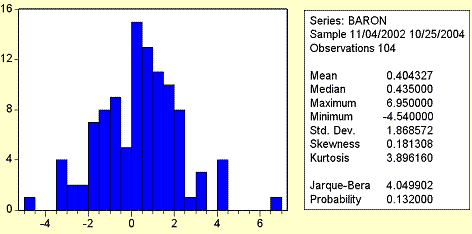
As you can see from the data on each interval Sharpe ratio is higher than Sortino ratio that means that in Sortino ratio DSR (downside risk) of fund has an higher impact (with a negative sign) on the performance of the fund, in other words the under-performance of the fund has been occurred more frequently, on the observed sample period, than an out-performance. This conclusion has been confirmed by Baron Histogram that shows how the return distribution is approximated as a Gaussian but the p-value is not so high: there is a left negative tail which stresses more bad results than the good ones.
5. Information Ratio This index provides a performance measure of Baron Fund in relation to benchmark performance, so it gives us an outlook of how good or how bad we performed with respect to the Russell Index.
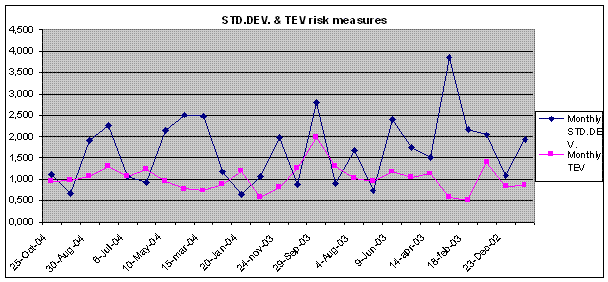
As you can see from the table above, Baron Fund is under-performing with respect to Russell Index in the first year, while Baron is over performing during the second year, giving a negative result on the overall period and hence we arrived at a different conclusion with respect to that obtained just looking at Sharpe Ratio. That occurs because Sharpe ratio uses an absolute measure of risk while Information ratio uses a relative measure. To enlighten the significant difference between the two error measures we make another graph that shows monthly trend of standard deviation and TEV.
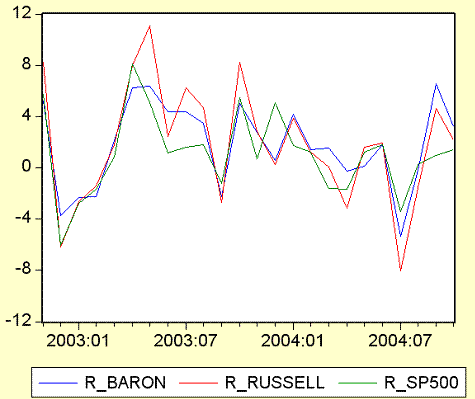
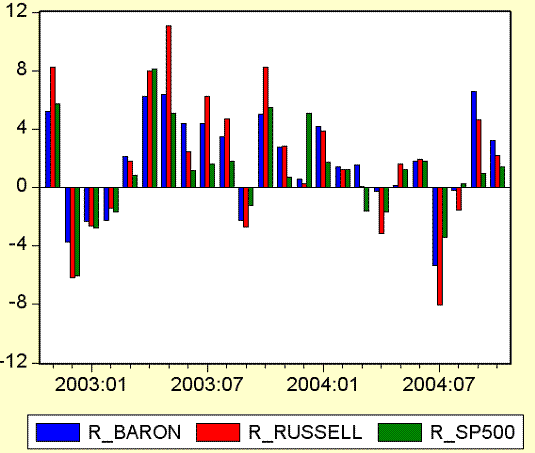
From this graph you can deduce that absolute variability of the Baron Fund is different from its relative variability with respect to the benchmark. We are in the situation of standard deviation high and TEV quite low which suggests a significant similar composition of the fund and the Russell index. That is the fund reflects quite well the variability of the index. However there are some remaining peaks in TEV which let us think to some structural differences between the fund and the index over time and may have an impact on the overall evaluation. In any case looking at TEV it seemed to occur a structural adequacy (smoothing of trend) between fund and index in the second year. 6. Overall qualitative assessment An overall conclusion can be argued from the graphs below, which depict the combined trend of the Baron, Russell and S&P 500 returns. The Russell Index (red line) shows higher peaks than Barons trend from November 2002 to November 2003, while the opposite trend occurs in the following year. For what concerning S&P index we can deduce from the graph a smoother trend that doesnt reflect relative max and min values of the other two.
Moreover you have seen how the choice of the risk measure is an essential step to determine the performance of this fund. However the two years time period seems to be too small to give a relative valuation of the fund with respect to the benchmark, even if the quite good results of the second examined year and the supposed structural adequacy let hope in future relative better performances.
The previous analysis is copyright © Global Risk Guard
|
|||||||||||||||||||||||||||||||||||||||||||||||||||||||||||||||||||||||||||||||||||||||||||||||||||||||||||||||||||||||||||||||||||||||||||||||||||||||||||||||||||||||||||||||||||||||||||||||||||||||||||||
|
[Home] [Virtual Library] [Articles] [GRG Services] [Topics] [Internal Auditing] [Risk Management] [Asset Management] [IAS-IFRS] [Risk Jobs] [News] [Softwares] [Books] [Sponsors] [Links] [Contact Us] [Feedback] [Blog] |
|
Copyright ©2005-2009 Global Risk Guard. All rights reserved. | Legal | |
|
|
|
|